Volume delta
- Price
- Volume
- Buy volume
CVD since start of day · 20 · ×3
- Strong buying
- Strong selling
- Bearish divergence
- Bullish divergence
- Delta
- Delta in %
- CVD
Buys minus sells per candle, plus CVD. Counts for every candle how much volume came from buys and how much from sells, by the side that triggered the trade (taker). The delta is buys minus sells, the CVD (cumulative delta) the sum since the start of the day or week or over the last candles. “Strong buying” reports a delta that is a multiple of the average, a divergence a new high at which more was sold than bought, or a new low at which more was bought. Not every exchange reports the buy volume: the exchange selection on the candle shows which ones do; otherwise the node stays empty. Example: “Bearish delta divergence” reports when BTC rises to a new high of the last 20 hours but more was sold than bought in those hours.
What it looks like
Section titled “What it looks like”- CVD since start of day, below
- strong buying
- strong selling
- Div: new high without buyers or low without sellers
Setting it in the chart
Section titled “Setting it in the chart”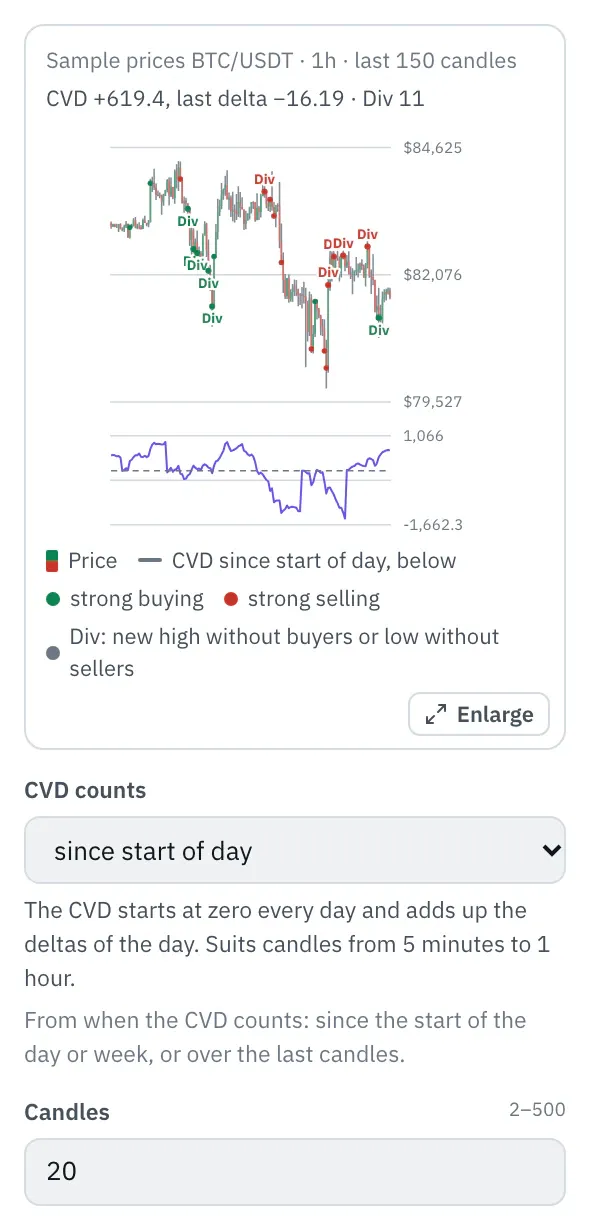
In the properties, a chart shows the last 150 candles and on top of them what the node finds with your settings; dotted or dashed is what it did not know yet at that time. The top line shows the state at the last candle, and the chart follows every setting right away.
More under Smart money and Chart above the price.
Settings
Section titled “Settings”The settings appear on the right under “Properties” once you click the node on the board. Below each field you find the same explanation as here.
CVD counts
Section titled “CVD counts”From when the CVD counts: since the start of the day or week, or over the last candles.
- since start of day (default): The CVD starts at zero every day and adds up the deltas of the day. Suits candles from 5 minutes to 1 hour.
- since start of week: The CVD starts at zero every Monday. Suits 1-hour and 4-hour candles.
- over the last candles: The CVD is the sum of the deltas of the last candles (setting “Candles”), without a fixed start. It shows who was ahead lately, on daily candles too.
Candles
Section titled “Candles”How many candles the average for strong buying and selling and the divergence cover, with “over the last candles” the CVD too. 20 hourly candles are just under a day.
Strong from
Section titled “Strong from”How much larger than the average of the candles before the delta has to be for “Strong buying” or “Strong selling” to be true. With 3 this reports about every other day per direction on hourly BTC candles.
Time zone
Section titled “Time zone”The time zone in which the day, week and month begin. The default is UTC, like the exchanges’ daily candles; in Berlin that is 1:00 AM in winter and 2:00 AM in summer. With Europe/Berlin the day begins at midnight German time.
Example
Section titled “Example”Notifies you when BTC rises to a new high of the last 20 hours but more was sold than bought in those hours.
How to connect the nodes:
- Candle (Price) → Volume delta (Price)
- Candle (Volume) → Volume delta (Volume)
- Candle (Buy volume) → Volume delta (Buy volume)
- Volume delta (Bearish divergence) → Telegram (Trigger)
On the board it reads: CVD since start of day · 20 · ×3
Chain as JSON
To try it, copy it and paste it in the editor under “Import”. Importing creates a new chain.
{ "name": "Example: Volume delta", "version": 1, "nodes": [ { "id": "c1", "type": "core.candle", "position": { "x": 40, "y": 40 }, "settings": { "pair": "BTC/USDT", "timeframe": "1h" } }, { "id": "v1", "type": "core.volume-delta", "position": { "x": 260, "y": 40 }, "settings": {} }, { "id": "t1", "type": "core.telegram", "position": { "x": 480, "y": 40 }, "settings": {} } ], "edges": [ { "from": "c1.close", "to": "v1.close" }, { "from": "c1.volume", "to": "v1.volume" }, { "from": "c1.buyVolume", "to": "v1.buyVolume" }, { "from": "v1.bearish", "to": "t1.in" } ]}Inputs and outputs
Section titled “Inputs and outputs”Only matching types connect: number series to number series (round pin), signal to signal (square), message to message (diamond).
| Direction | Pin | Type | Note |
|---|---|---|---|
| Input | Price | Number series | required |
| Input | Volume | Number series | required |
| Input | Buy volume | Number series | required |
| Output | Strong buying | Signal (true/false) | – |
| Output | Strong selling | Signal (true/false) | – |
| Output | Bearish divergence | Signal (true/false) | – |
| Output | Bullish divergence | Signal (true/false) | – |
| Output | Delta | Number series | – |
| Output | Delta in % | Number series | in percent |
| Output | CVD | Number series | – |
Good to know
Section titled “Good to know”- In messages the values are called “Delta”, “Delta %”, “CVD”.
- Warm-up with the default settings: 25 candles (this many extra candles are loaded by the replay before the value is reliable).
- Search also finds it under: delta, volume delta, cvd, cumulative delta, order flow, buyers, sellers, taker, buying pressure, selling pressure, divergence, absorption.
Technical details
Section titled “Technical details”Delta = 2 × buy volume − volume; the buy volume is the taker buys as the exchange reports them per candle. Share = delta / volume × 100. CVD: sum of the deltas since the start of the day or week (from Monday) in the time zone, the first, cut-off session stays empty; or the sum of the last N deltas. Strong: |delta| ≥ factor × average of |delta| over the N candles before. Bearish divergence: close above all N closes before and the sum of the deltas of these N + 1 candles below zero; bullish mirrored. If a candle lacks the buy volume, everything that needs it stays empty.
- Type in the chain:
core.volume-delta· Version 1.0.0 · Category keyind - Settings in the chain:
reset(CVD counts),length(Candles),factor(Strong from),timezone(Time zone) - Pins in the chain: Input
close,volume,buyVolume· OutputstrongBuy,strongSell,bearish,bullish,delta,share,cvd - Reference tests in the manifest: 1 (with fixed price data: 500 candles of 1h)
- How a node is built
Version 2026.10.25.16 · Changelog