Smart money
“Smart money” (SMC for short, smart money concepts) is a way of reading charts that is widespread among crypto traders: you follow the structure of highs and lows, look for zones where large orders sat, gaps a fast market leaves behind, and places where many stops are waiting. Bellchain has six nodes for it. This chapter explains the terms, how exactly Bellchain defines them and why an alert can only report something once it is certain.
The terms have no single definition; every tool draws the lines a little differently. For each node Bellchain picked a clear rule that you can recompute, that works the same in the replay and live, and that never shifts anything afterwards. The rules are on this page and in the technical details of each node.
The basis: confirmed swings
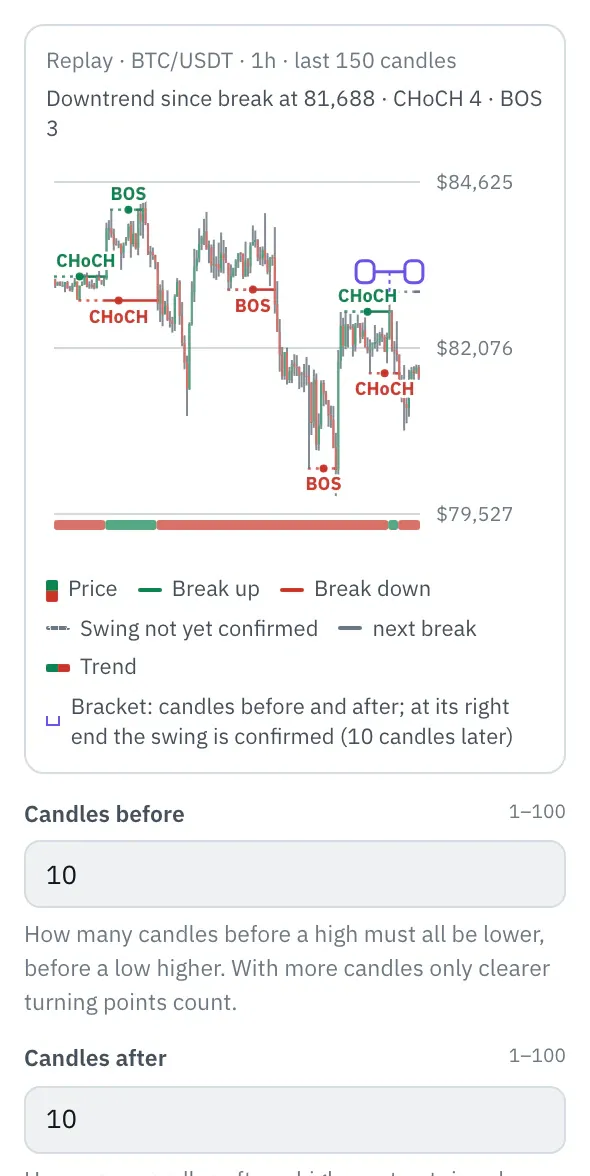
Section titled “The basis: confirmed swings”Almost everything builds on swings, as in the Swing points node: a swing high is a high above the candles before it that the candles after it do not exceed. A swing low likewise. You set how many candles before and after count; the default is 10 · 10.
Whether a high was a swing is only certain once the candles after it have closed. With 10 candles after on hourly candles, that is 10 hours. Only from then on does the swing count in Bellchain. Charts instead draw swings back at the high itself and therefore look better in hindsight than any rule that only knows what was certain at the time. Bellchain shows this delay openly: in the chart below and in the chart above the price, every line is dotted until its swing is confirmed.
- Break up
- Break down
- Swing not yet confirmed
- next break
- Trend
So if the price runs quickly past a brand-new high, it does not break structure yet. With fewer candles after (say 5 · 5) swings count sooner, but smaller turning points count too; with more candles only the clear ones remain.
The terms and how Bellchain computes them
Section titled “The terms and how Bellchain computes them”| Node | What it finds | When Bellchain knows it |
|---|---|---|
| Market structure | trend, break of structure (BOS), change of character (CHoCH) | the break on the candle that closes beyond; the swing itself counts from its confirmation |
| Order blocks | the candle a break started from, as a zone | with the break, often many candles after the order block candle |
| Fair value gaps | gaps between three candles, open, partially or completely filled | with the close of the third candle |
| Liquidity sweeps | a spike above a swing high or below a swing low and back, equal highs and lows | on the candle that closes back; the swing counts from its confirmation |
| Premium/discount | where the price sits in the range of the last swings | the range from the confirmation of its swings |
| S/R zones | support and resistance from several swings | each swing from its confirmation |
Market structure: trend, BOS and CHoCH
Section titled “Market structure: trend, BOS and CHoCH”The latest confirmed swing high and low are tracked. If a candle closes above the swing high, structure has broken upward; if it closes below the swing low, downward. With “Break by: wick”, the high or low alone is enough. Each swing breaks at most once.
- BOS (break of structure): a break in the direction of the trend; the trend continues.
- CHoCH (change of character): the first break against the trend before, often the first sign of a reversal.
- Trend: follows the last break. Without a break in the 500 candles before there is no trend, and the first break is a BOS.
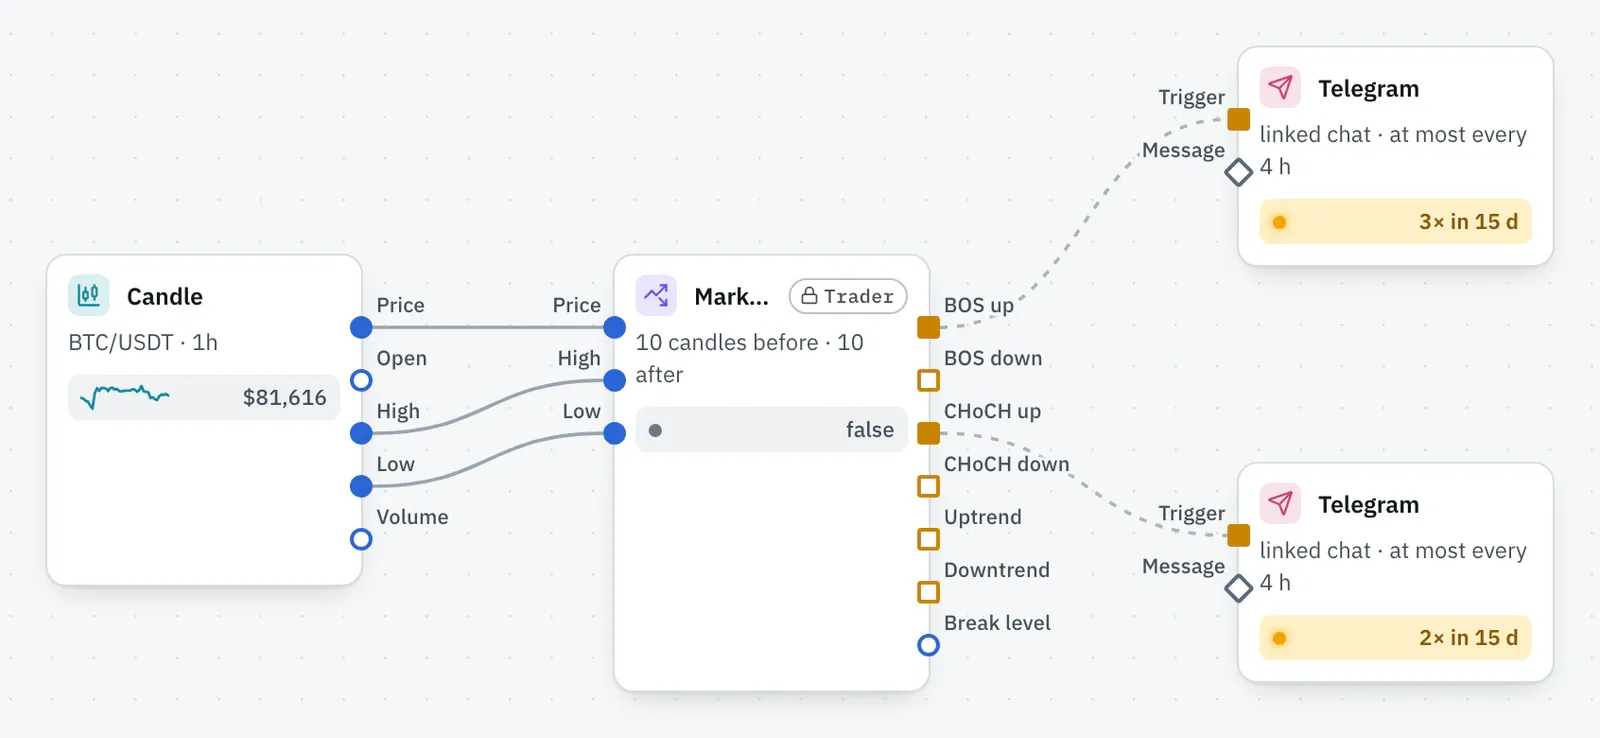
The node outputs BOS and CHoCH per direction as separate signals, plus “Uptrend” and “Downtrend” as states and the level of the last break.
Order blocks
Section titled “Order blocks”When the price breaks above a swing high, the bullish order block is the candle with the lowest low between the swing high and the break: that is where the rise that broke structure began. The bearish one is the candle with the highest high before a break downward. The zone runs from the low to the high of that candle.
- untouched: no candle has reached the zone since the break.
- mitigated: a candle has reached it. With “untouched only” the order block no longer counts after that; many consider the first return the strongest.
- broken: a candle closes beyond the zone (bullish: below it). Then it never counts again.
- Order block
- not known yet, until the break
- broken swing level
- Price reaches OB
Fair value gaps
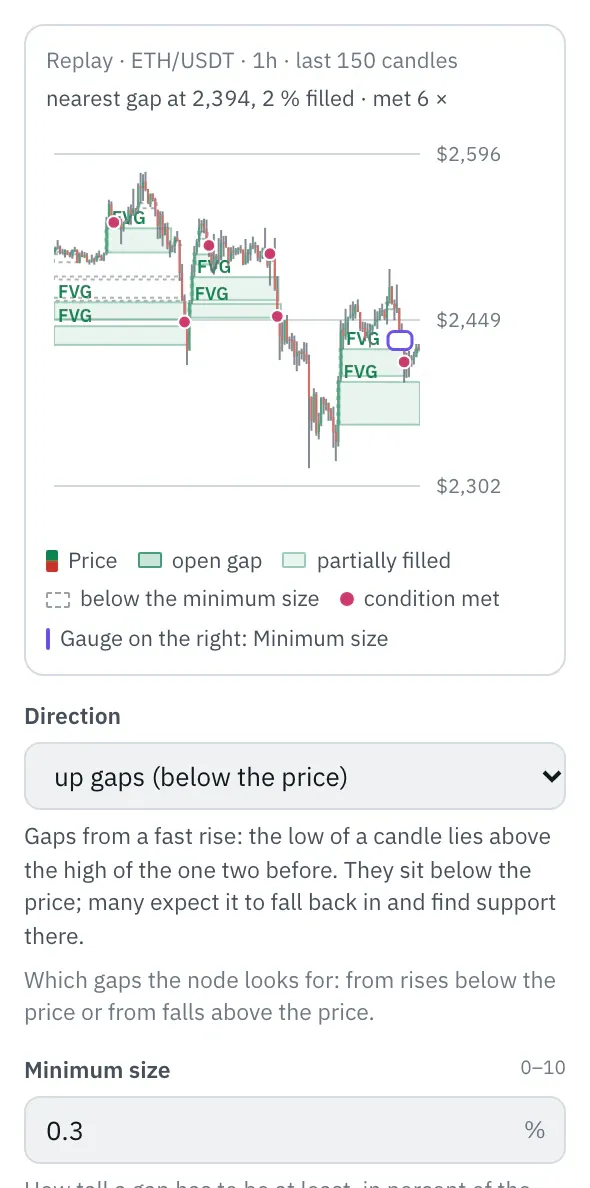
Section titled “Fair value gaps”If the low of a candle lies above the high of the one two before, no trade happened in between: an up gap from that high to that low. A down gap forms the other way round. The minimum size in percent filters out small gaps; for BTC on hourly candles half of all gaps are smaller than 0.12 %.
- open: no candle has reached into it yet.
- partially filled: a candle has reached in, but not all the way through. The output “Filled %” says how deep.
- completely filled: a candle has reached the other edge. Then the gap no longer counts.
- open gap
- partially filled
- below the minimum size
- Price enters gap
Liquidity sweeps
Section titled “Liquidity sweeps”Above swing highs and below swing lows sit many stops and orders, the liquidity. A sweep is a spike beyond, after which the price closes back inside right away: the orders are taken, the breakout does not hold. If the price closes beyond and stays there, that is a breakout and not a sweep. With “Return within” 2 or 3 candles, excursions that briefly close beyond count too.
If two swing highs are at most 0.1 % apart (adjustable), they count as equal highs (EQH, for lows EQL). Especially much liquidity gathers there; the sweep then needs a spike above the higher of the two.
- Liquidity below swing lows
- Swing not yet confirmed
- Sweep
- EQL: equal lows
Premium, discount and equilibrium
Section titled “Premium, discount and equilibrium”The range runs from the lowest low since the last confirmed swing low to the highest high since the last swing high; if the price rises above it, it grows with it. The upper half is premium (expensive), the lower half discount (cheap), around the middle lies the equilibrium, from 45 to 55 % by default. Many traders prefer to buy in discount and sell in premium.
- Premium
- Equilibrium
- Discount
- in discount
S/R zones
Section titled “S/R zones”If several swing highs and lows of the last 300 candles are at most 0.5 % apart, they form a zone; the more swings, the stronger. Bellchain first takes the zone with the most swings, then the next from the remaining ones without overlap, at most 10. Zones below the price are support, above it resistance. The zones form anew on every candle from the swings confirmed up to then.
- Support, number of swings
- Resistance
- Swing in a zone
In the chart above the price
Section titled “In the chart above the price”When you select one of these nodes on the board, the “Properties” panel shows a chart of the latest 150 candles at the top: what the node finds with the current settings, as lines, boxes, areas and marks. The data comes from the last replay, otherwise from the sample prices. When a setting changes, the chart follows right away.
- Dotted or dashed is everything the node did not know yet at that time: the line until the swing is confirmed (dotted), the order block until the break and the gap until its third candle (dashed).
- The bracket at the latest swing shows the candles before and after. Drag its ends horizontally to change “Candles before” and “Candles after”; at its right end the swing is confirmed.
- The gauge on the right edge shows a size in percent of the price: the minimum size of a gap, the tolerance for equal highs or the width of a zone. Drag it vertically; gaps below the minimum size appear as outlines.
- For premium/discount you drag the edges of the equilibrium on the right edge.
More about the chart is under Settings.
Recipes
Section titled “Recipes”- Break of market structure upward: market structure, “BOS up” and “CHoCH up” to one action each. Ready-made as a template: BTC Breaks Structure Upward.
- Pullback into a fair value gap in an uptrend: “Uptrend” of the market structure and “Price enters gap” of an up gap into AND. Template: ETH Pullback into a Fair Value Gap.
- Sweep, then reversal: “Sweep” below lows to “First A” of Then, “CHoCH up” to “Then B”. Template: SOL Sweep Below the Low, Then Reversal.
- Break downward: “BOS down” and “CHoCH down” to one action each, say as a warning if you hold the coin. Template: AVAX Breaks Structure Downward.
- Reversal in discount: “CHoCH up” of a smaller market structure (5 · 5) and “In discount” into AND. Template: BTC Reversal in Discount.
- Sweep above equal highs: liquidity sweeps “above highs” with “equal highs and lows only”. Template: XRP Sweep Above Equal Highs.
- Breakout from a zone: S/R zones with “Breakout above zone” and “Breakdown below zone” to one action each. Template: ETH Breakout from an S/R Zone.
- Order block in discount: “Price reaches OB” (bullish, untouched only) and “In discount” into AND. This only reports returns into zones that lie in the cheap half of the range. Template: LINK Order Block in Discount.
- Retest after the break: Band around “Break level” of the market structure, condition “enters the band”, plus “Uptrend” into AND. This reports when the price comes back to the broken high after a break upward. Template: BTC Retest After the Break.
- Half of the gap filled: Compare on “Filled %”, condition “crosses above” 50. Many traders call the middle of a gap consequent encroachment. Template: BNB Gap Half Filled.
In the plan
Section titled “In the plan”The six smart money nodes come with Trader, like the volume profile: Trader stands for the tools for market structure and volume. On Free and Pro you can still drag them onto the board and test the chain in the replay; it activates with Trader. To report breakouts above swings on Pro, use Swing points with Compare A/B. Which nodes come with which plan is listed under Plans.
Limits
Section titled “Limits”- Candles only. Smart money is about large orders; Bellchain only sees the price and volume of the candles, no order books, no volume delta and no single trades.
- One timeframe per chain. The higher structure of a larger timeframe (say the 4-hour structure in a 15-minute chain) does not exist yet; use a second chain with the larger timeframe for that.
- 500 candles of memory. Swings, order blocks, gaps and pools count for at most 500 candles, and the trend lasts up to 500 candles after the last break. That way no value depends on how far back the loaded candles go; in return Bellchain forgets very old zones.
- Other definitions elsewhere. Charts with other rules, such as swings only from the candles after or order blocks from the last opposite candle, show some zones in a different place.
- No recommendation. Bellchain reports what you set up. Whether an order block holds or a sweep leads to a reversal is not something we judge.
Version 2026.10.21.23 · Changelog