MFI
- Price
- High
- Low
- Volume
14 candles
- MFI
- oversold
- overbought
RSI with volume: money flow, 0–100. Like the RSI, but with volume: the Money Flow Index compares the money that flowed on rising candles over the last candles with the money on falling candles and turns that into a number from 0 to 100. It works with the typical price, the mean of high, low and close, times volume. Above 80 counts as overbought, below 20 as oversold; the “overbought” and “oversold” outputs report this, and you drag the thresholds in the chart below the price. Example: “MFI 14 below 20” reports a sell-off in which almost all of the volume came on falling candles, often shortly before a rebound.
What it looks like
Section titled “What it looks like”- Price (close of each candle)
- MFI 14
- below 20 and above 80
- drops below 20
Setting it in the chart
Section titled “Setting it in the chart”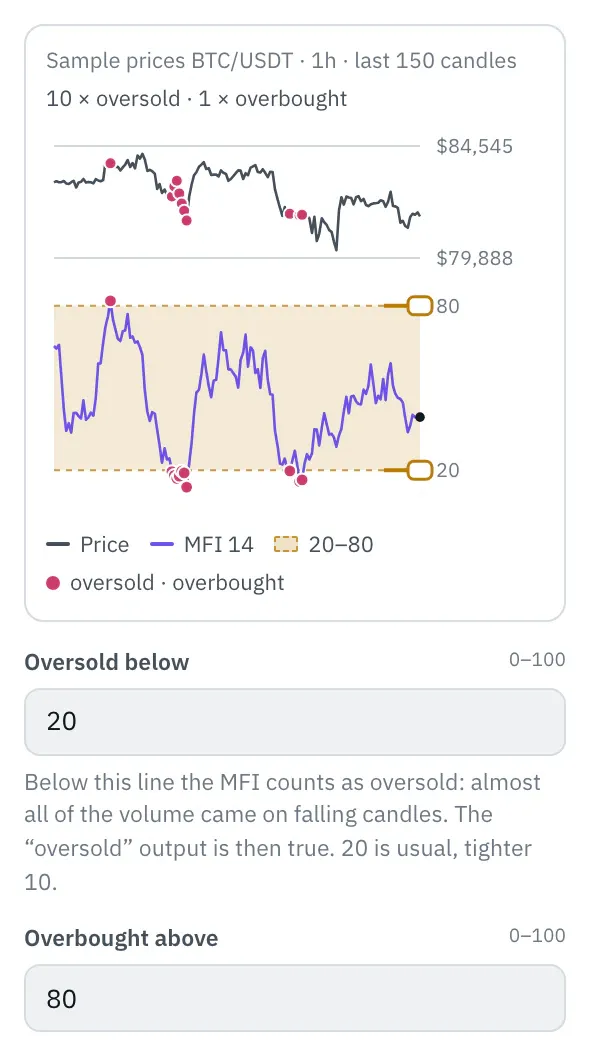
The properties show the price of the last 150 candles at the top and MFI below it, with the zone between the thresholds. Drag a threshold or type it; the number in the field follows in whole steps. Dots on the price show where “oversold” or “overbought” would be true, the top line shows how often.
More under Chart below the price.
Settings
Section titled “Settings”The settings appear on the right under “Properties” once you click the node on the board. Below each field you find the same explanation as here.
Candles
Section titled “Candles”How many candles inflow and outflow are summed over. 14 is the usual value. Fewer candles make the MFI faster and jumpier, more candles calmer.
Oversold below
Section titled “Oversold below”Below this line the MFI counts as oversold: almost all of the volume came on falling candles. The “oversold” output is then true. 20 is usual, tighter 10.
Overbought above
Section titled “Overbought above”Above this line the MFI counts as overbought: almost all of the volume came on rising candles. The “overbought” output is then true. 80 is usual, tighter 90.
Example
Section titled “Example”Notifies you when the MFI 14 drops below 20: almost all of the volume of the last 14 candles came on falling candles.
How to connect the nodes:
- Candle (Price) → MFI (Price)
- Candle (High) → MFI (High)
- Candle (Low) → MFI (Low)
- Candle (Volume) → MFI (Volume)
- MFI (MFI) → Compare (Value)
- Compare (true/false) → Telegram (Trigger)
On the board it reads: 14 candles
Chain as JSON
To try it, copy it and paste it in the editor under “Import”. Importing creates a new chain.
{ "name": "Example: MFI", "version": 1, "nodes": [ { "id": "c1", "type": "core.candle", "position": { "x": 40, "y": 40 }, "settings": { "pair": "BTC/USDT", "timeframe": "1h" } }, { "id": "m1", "type": "core.mfi", "position": { "x": 260, "y": 40 }, "settings": {} }, { "id": "k1", "type": "core.compare", "position": { "x": 480, "y": 40 }, "settings": { "operator": "below", "value": 20 } }, { "id": "t1", "type": "core.telegram", "position": { "x": 700, "y": 40 }, "settings": {} } ], "edges": [ { "from": "c1.close", "to": "m1.close" }, { "from": "c1.high", "to": "m1.high" }, { "from": "c1.low", "to": "m1.low" }, { "from": "c1.volume", "to": "m1.volume" }, { "from": "m1.out", "to": "k1.in" }, { "from": "k1.out", "to": "t1.in" } ]}Inputs and outputs
Section titled “Inputs and outputs”Only matching types connect: number series to number series (round pin), signal to signal (square), message to message (diamond).
| Direction | Pin | Type | Note |
|---|---|---|---|
| Input | Price | Number series | required |
| Input | High | Number series | required |
| Input | Low | Number series | required |
| Input | Volume | Number series | required |
| Output | MFI | Number series | – |
| Output | oversold | Signal (true/false) | – |
| Output | overbought | Signal (true/false) | – |
Good to know
Section titled “Good to know”- In messages the value is called “MFI 14”.
- Warm-up with the default settings: 15 candles (this many extra candles are loaded by the replay before the value is reliable).
- Search also finds it under: mfi, money flow index, money flow, volume, overbought, oversold.
Technical details
Section titled “Technical details”Money flow as typical price (high + low + close) / 3 times volume, split by rising and falling typical price and summed over the candles, MFI as 100 − 100 / (1 + inflow / outflow), 100 without outflow; the same formula as ta.mfi in TradingView, like the built-in Money Flow Index with hlc3.
- Type in the chain:
core.mfi· Version 1.0.0 · Category keyind - Settings in the chain:
length(Candles),oversold(Oversold below),overbought(Overbought above) - Pins in the chain: Input
close,high,low,volume· Outputout,oversold,overbought - Reference tests in the manifest: 2 (with fixed price data: 500 candles of 1h)
- How a node is built
Version 2026.10.21.23 · Changelog