Optimal trade entry
- Price
- High
- Low
62 % – 79 % · 10 candles before · 10 after
- Bullish OTE reached
- Bearish OTE reached
- Close in OTE
- Swing broken
- Top
- Bottom
- Middle
Pullback into 62–79 % of the last swing. Places the optimal trade entry zone between 62 and 79 % retracement of the last swing, with its middle at 70.5 %. After an up swing this is the bullish OTE below the price, after a down swing the bearish one above it. The node reports the first candle that reaches the zone and a close inside it; if the price closes beyond the start of the swing, the swing is broken and the zone no longer counts. The swing is the same as for the Fibonacci levels and changes when a new swing is confirmed. Example: “Price reaches bullish OTE” reports when SOL, after a rise, comes back into the deep pullback between 62 and 79 %.
What it looks like
Section titled “What it looks like”- Zone after an up swing, dashed until confirmed
- after a down swing
- pale: swing broken
- Swing
- Price reaches the zone
Setting it in the chart
Section titled “Setting it in the chart”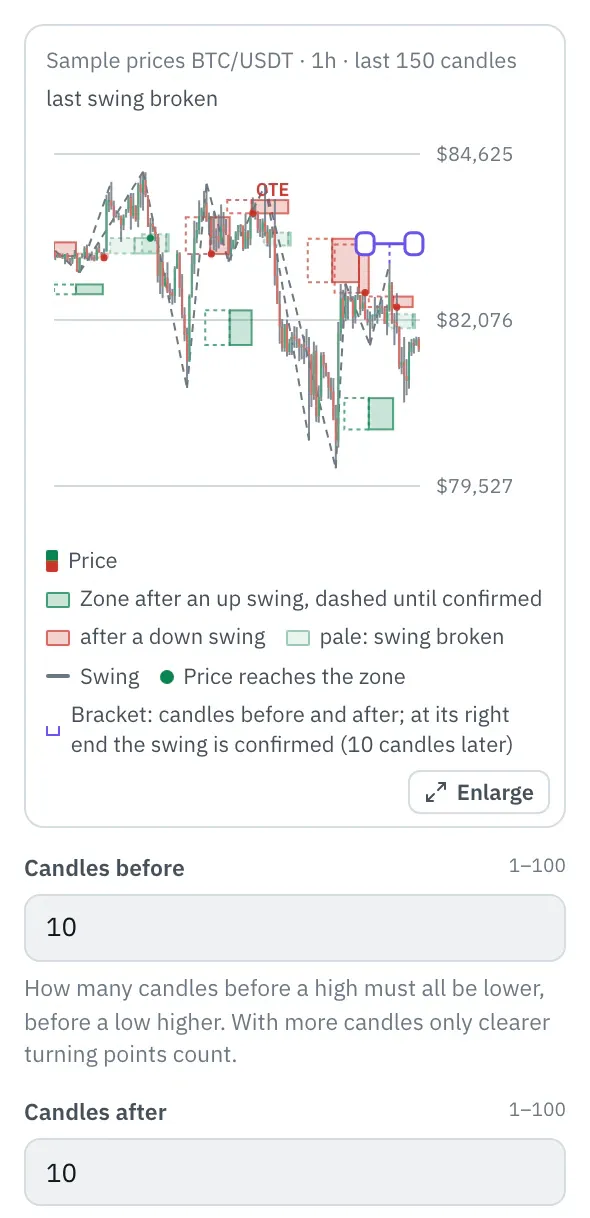
In the properties, a chart shows the last 150 candles and on top of them what the node finds with your settings; dotted or dashed is what it did not know yet at that time. Drag the ends of the bracket at the latest swing to change “Candles before” and “Candles after”; at its right end the swing is confirmed. The top line shows the state at the last candle, and the chart follows every setting right away.
More under Smart money and Chart above the price.
Settings
Section titled “Settings”The settings appear on the right under “Properties” once you click the node on the board. Below each field you find the same explanation as here.
Candles before
Section titled “Candles before”How many candles before a high must all be lower, before a low higher. With more candles only clearer turning points count.
Candles after
Section titled “Candles after”How many candles after a high must not rise above it before it counts as a swing. The node reports it that many candles later; with fewer candles the report comes sooner, but also for smaller turning points.
Zone from
Section titled “Zone from”How far the pullback reaches at least, in percent of the swing. 62 % sits just above the golden ratio (61.8 %).
Zone to
Section titled “Zone to”How far the pullback reaches at most. 79 % sits at the Fibonacci level of 78.6 %.
Example
Section titled “Example”Notifies you when SOL, after a rise, comes back into the zone between 62 and 79 % retracement.
How to connect the nodes:
- Candle (Price) → Optimal trade entry (Price)
- Candle (High) → Optimal trade entry (High)
- Candle (Low) → Optimal trade entry (Low)
- Optimal trade entry (Bullish OTE reached) → Telegram (Trigger)
On the board it reads: 62 % – 79 % · 10 candles before · 10 after
Chain as JSON
To try it, copy it and paste it in the editor under “Import”. Importing creates a new chain.
{ "name": "Example: Optimal trade entry", "version": 1, "nodes": [ { "id": "c1", "type": "core.candle", "position": { "x": 40, "y": 40 }, "settings": { "pair": "SOL/USDT", "timeframe": "1h" } }, { "id": "o1", "type": "core.ote", "position": { "x": 260, "y": 40 }, "settings": {} }, { "id": "t1", "type": "core.telegram", "position": { "x": 480, "y": 40 }, "settings": {} } ], "edges": [ { "from": "c1.close", "to": "o1.close" }, { "from": "c1.high", "to": "o1.high" }, { "from": "c1.low", "to": "o1.low" }, { "from": "o1.bullish", "to": "t1.in" } ]}Inputs and outputs
Section titled “Inputs and outputs”Only matching types connect: number series to number series (round pin), signal to signal (square), message to message (diamond).
| Direction | Pin | Type | Note |
|---|---|---|---|
| Input | Price | Number series | required |
| Input | High | Number series | required |
| Input | Low | Number series | required |
| Output | Bullish OTE reached | Signal (true/false) | – |
| Output | Bearish OTE reached | Signal (true/false) | – |
| Output | Close in OTE | Signal (true/false) | – |
| Output | Swing broken | Signal (true/false) | – |
| Output | Top | Number series | appears in messages as a price, e.g. “$81,616” |
| Output | Bottom | Number series | appears in messages as a price, e.g. “$81,616” |
| Output | Middle | Number series | appears in messages as a price, e.g. “$81,616” |
Good to know
Section titled “Good to know”- In messages the values are called “OTE top”, “OTE bottom”, “OTE middle”.
- Warm-up with the default settings: 520 candles (this many extra candles are loaded by the replay before the value is reliable).
- Search also finds it under: ote, optimal trade entry, fibonacci, pullback, retracement, 62, 79, 70.5, entry, smart money, smc, ict.
Technical details
Section titled “Technical details”Swing as in the Fibonacci levels node: the last two points of a zigzag line through the confirmed swings of the last 500 candles. Level = end − ratio × (end − start); zone between the “Zone from” and “Zone to” levels, middle at their mean. Per swing: “reaches” on the first candle with low ≤ top and high ≥ bottom; broken when a close lies below the start (up) or above it, after which it no longer counts. The edges hold while the swing counts.
- Type in the chain:
core.ote· Version 1.0.0 · Category keyind - Settings in the chain:
left(Candles before),right(Candles after),from(Zone from),to(Zone to) - Pins in the chain: Input
close,high,low· Outputbullish,bearish,inside,failed,top,bottom,sweet - Reference tests in the manifest: 1 (with fixed price data: 500 candles of 1h)
- How a node is built
Version 2026.10.25.16 · Changelog