Volume profile
A volume profile shows at which prices trading happened in a session, such as yesterday. Many traders see it as the fair price of the day: where a lot of volume traded, buyers and sellers agreed. The price often returns there, swings around it for a while, or breaks away from it and then runs far. Bellchain has nodes for this; this chapter explains the terms, how Bellchain computes them and how you build alerts with them.
The terms
Section titled “The terms”- Session: the period of a profile, in Bellchain a calendar day in UTC. You can also pick week or month and another time zone.
- POC (point of control): the price with the most volume in the session.
- Value area: the range around the POC that held 70 % of the volume.
- VAH and VAL (value area high and low): the upper and lower edge of the value area.
- Naked POC: a POC of an earlier session that the price has not reached since. Many traders expect the price to return there.
- Price (close of each candle)
- volume profile of the day, value area stronger
- prior day POC
- prior day VAH and VAL
The chart is computed by the Volume profile node itself from fixed price data: each day shows its profile as bars, the lines are the POC, VAH and VAL of the day before. A chain computes the same way: from 0:00 UTC, yesterday’s profile applies all day.
How Bellchain computes the profile
Section titled “How Bellchain computes the profile”A profile actually needs every single trade. Bellchain computes it from the chain’s candles, as charts do when they don’t load trades:
- The session’s range, from the lowest low to the highest high, is split into 50 price levels of equal height.
- Each candle’s volume is spread evenly over its range from low to high. A candle touching three levels gives each its share, depending on how much of its range lies in the level.
- The POC is the middle of the level with the most volume. If two levels have the same, the one closer to the middle of the range counts.
- The value area grows from the POC level by level: the neighbouring level above or below with more volume is added until 70 % of the volume lies inside. VAH is its top edge, VAL its bottom edge.
On top of that:
- Only completed sessions. With “previous session” the profile is fixed from the first candle of the new day and does not change again. With “current session” the node computes the profile up to each candle; POC and value area move along, and on the day’s last candle it is exactly the profile that counts as the previous one the next day. That way the replay and live operation compute the same.
- The first, partial session stays empty. If the loaded candles begin in the middle of a day, part of it is missing. The replay therefore loads two days of warm-up.
- The volume is that of the exchange in your candle, not of the whole market. Different exchanges can therefore have their POC somewhat apart.
How accurate is that?
Section titled “How accurate is that?”We compared daily profiles from candles with profiles from 1-minute candles, the finest data available without trades: 30 days of BTC/USDT, ETH/USDT and SOL/USDT, so 90 days. The table shows how far the POC, VAH and VAL were off in the median, in percent of the price, and at least on every tenth day:
| Chain candles | POC median | POC every 10th day | VAH and VAL median | VAH and VAL every 10th day |
|---|---|---|---|---|
| 15 minutes | 0.05 % | 0.7 % | 0.05 % | 0.2 % |
| 1 hour | 0.09 % | 0.9 % | 0.08 % | 0.45 % |
| 4 hours | 0.3 % | 1.1 % | 0.12 % | 0.7 % |
What follows:
- For daily profiles, 15-minute or 1-hour candles. 4-hour candles are too coarse for a day, six candles don’t make a fine profile; for weeks and months they fit.
- The POC jumps on some days. If a day has two almost equally strong peaks, a small difference decides which one leads; then the POC sits one or two percent elsewhere. That happens to charts computing from finer data too. VAH and VAL are steadier.
- Don’t make bands too narrow. A band of ±0.3 % around the POC absorbs the inaccuracy from hourly candles on ordinary days; narrower than ±0.1 % only pays off with 15-minute candles.
A profile from trades and the volume delta (buys against sells) are not part of Bellchain yet.
Bands around POC, VAH and VAL
Section titled “Bands around POC, VAH and VAL”The Band node places ±x % around a line, such as the POC, and checks on every candle where the price stands: inside the band, outside, when entering or leaving, on a breakout up or down, or whether it swings around the line. Swinging means: the last candles all close inside the band, and the price crosses the line at least as often as set. With 12 hourly candles and 3 crossings, that is half a day in which the price changes sides three times without leaving the band.
You set the width in the chart above the last prices: drag the band with the mouse or your finger, or type the number into the field. Next to the percent you see how far that is in dollars, and the chart shows right away how many candles lie inside the band and where the condition would be met.
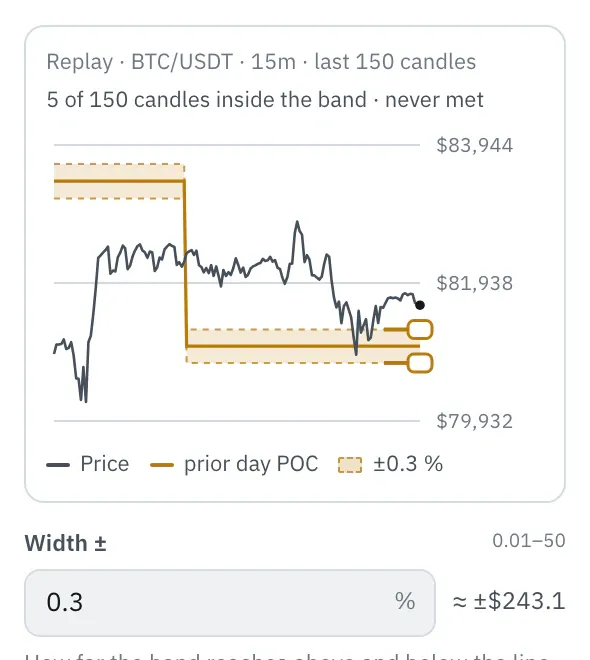
More about the chart in the settings is under Settings.
Recipes
Section titled “Recipes”- Price rotates around yesterday’s POC: Candle → Volume profile (POC) → Band at “Line”, price at “Value”, condition “swings around the line”. Ready-made as a template: BTC Rotates Around Yesterday’s POC.
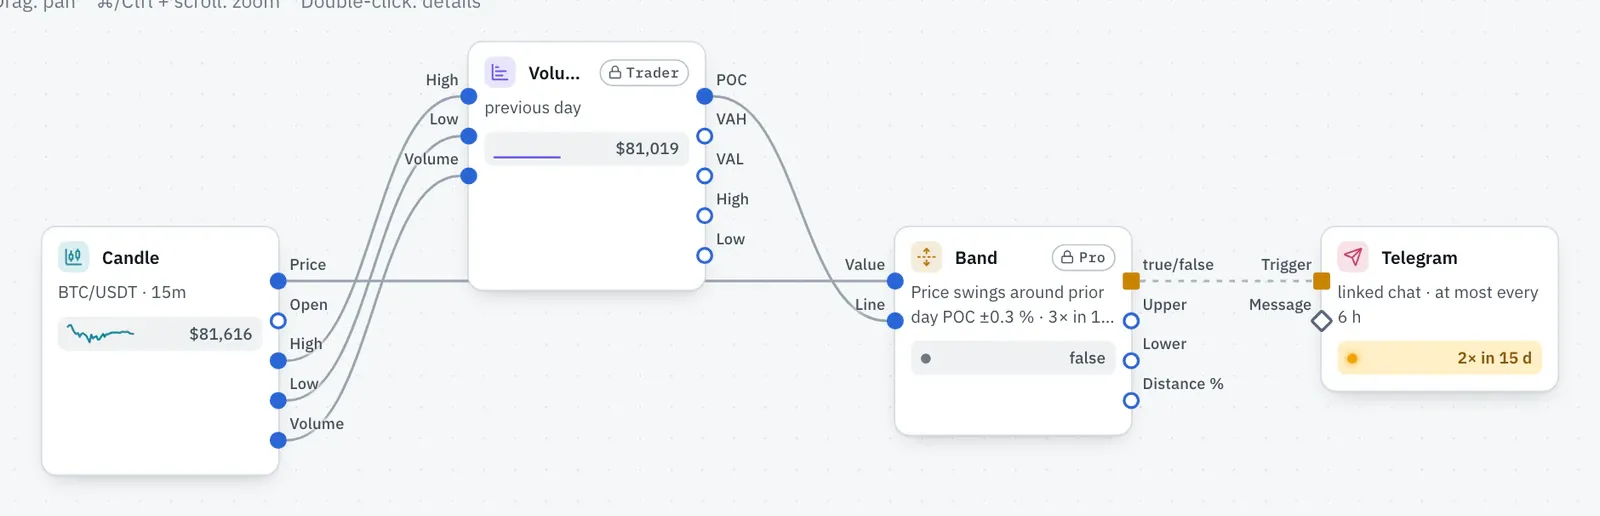
- Price comes near the POC: the volume profile’s near output straight to an action, with no Band in between. In the chart in the properties you pick the level with a click, such as POC or VAH, and drag the band, such as ±0.3 %; near is true as soon as a candle’s high or low reaches into it.
- Back into yesterday’s value area: VAL and VAH of the volume profile to the Low and High inputs of the Range node, price to “Value”, condition “enters”. Many traders watch this moment when the day opened outside the value area.
- Breakout above the value area: Compare A/B with the price at A and VAH at B, condition “crosses above”. For a band around VAH instead of a line, use the Band with “breaks out upward”.
- Higher value area than yesterday: two volume profiles, one with session “current”, one with “previous”, and Compare A/B: VAL (current) above VAH (previous).
- Naked POC reached: Naked POC with the “reached” signal to an action.
- Breakout from the first hour: Opening range and Compare A/B with the price above its high, plus Previous period for yesterday’s high, low and close.
In the plans
Section titled “In the plans”Volume profile and Naked POC come with Trader; Band, Range, Previous period and Opening range with Pro. You can test any chain in the replay without the plan, it can be activated with it, see Plans.
Limits
Section titled “Limits”- No profile from trades, no volume delta, no footprint candles.
- Sessions by the calendar, not over a drawn range: a profile over a section you mark in the chart would depend on what is currently visible.
- No market profile by time (TPO, single prints).
- Naked POCs of the last 1 to 20 sessions; the node forgets older ones so that nothing depends on how far back the loaded candles reach.
Version 2026.10.21.23 · Changelog